Look Alike Reports
Use Look Alike Reports to Analyze Customer/CRM Data
Look Alike Reports provide insight into your customer-base for hundreds of demographic, interest, purchase behavior data elements and segmentation models. By analyzing and appending data to your customers you will be able to clearly determine how your customers compare to individuals and households your market area. So, the look alike report does two things:
- It provides the absolute profile of your customers (e.g., share of customers by income range)
- It compares your customers to the local market (using the Market Index for each element range)
Knowing which demographic elements stand out among customers allows you to prioritize data for:
- Selecting data elements for prospect targeting
- Multi-channel marketing campaign test cell design
- Customer database / CRM Data Enhancement
- Data to create personalized messages
- Data to develop your analytic model
Data Marketing Strategies offers several Look Alike Report options. And we will consult with you to determine which is best for your needs.
One common report analyzes 25 different demographic data elements including an excellent life stage segmentation model. In addition, the look-alike analysis includes more than 40 buying categories and more than 140 interests.
Benefits of Look Alike Reports
If you have not yet quantified your customer demographics yet, a Look Alike Report will provide highly useful insights. You get the following key benefits:
- Standardized reports can be turned around in 1 to 2 business days and are very reasonably priced.
- The look-alike report provides a test of statistical validity (z-score) so you can be confident in the results.
- The data used to enhance customer records is high-quality and accurate. The underlying data is updated monthly.
Disadvantages of Look Alike Reports
We are here to advise you, so we will tell you about both pros and cons of each solution we offer. So here are some points to be aware of:
- A Look Alike Report may not include all of the key data elements you care about.
- The “index-based” analysis is performed on a single dimension at a time.
- These are “descriptive”, not “predictive” reports. This means that the key metrics are based on simple math, not advanced statistical analysis or machine learning.
Despite these points, Look Alike Reports provide a great starting point for profiling customers and prioritizing both targeting and data selection for analytic models. Finally, you will get a surprisingly quick turnaround and low price for the value delivered. Every client gains great insights from these reports.
How to Get the Most Out of Look Alike Report Insights
We recommend analyzing customers overall, as well as by key customer segments. For example, you may wish to understand how customers segments differ by:
- Product line – how do key demographics differ by Product A vs. B vs. C?
- Region – how do customer demographics differ by key region within the U.S.?
- Customer Value – how do the most profitable customers differ from the norm?
Also, to maintain a high level of statistical validity (the “z-score”) you should submit no fewer than 2,000 to 3,000 customer name/address records for matching.
Visualizing Your Data with a Look Alike Report
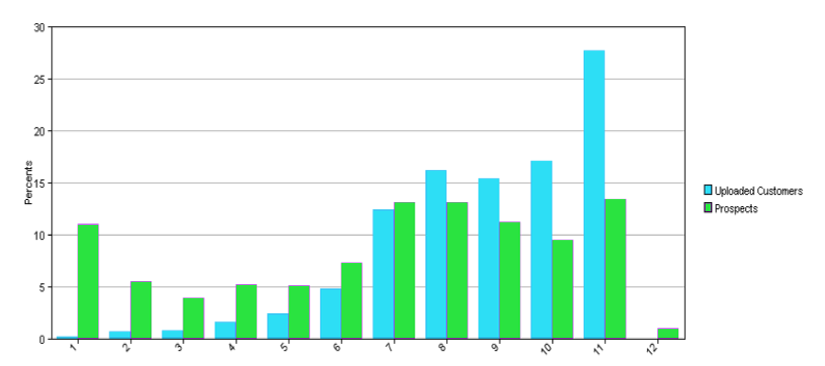
Because a picture is more easily interpreted than tables, Look Alike Reports provide simple visuals. They use bar charts to highlight both the absolute customer demographic profile and compare it to the market profile.
This graph shows the result of comparing uploaded customers vs. prospects.
Customer vs. Prospect Demographic Profile

Each vertical bar represents the share of customers and prospects that fall within a range of a demographic variable. So, for example, if this chart represented income ranges with range “11” being income of $150K+, then 27% of customers fall within this range but only 13% of prospects fall within this range.
What is the Market Index and How Do I Use It?
The Market Index is simply the ratio of the share of customers in the file vs. the share of prospects in the market area. In the case above for level “11” the Market Index is 27% divided by 13% or 2.08. Market research practice is to normalize based on 100 being average instead of 1.00, so this translates into a Market Index of 208.
So, in addition to absolute distribution (e.g., 90% of all of my customers are between ages 40 and 59) we also look for cases where the Market Index is peaking. We have seen many cases where the Market Index for a demographic range or interest can be 400 or more.
